A quick tutorial on how to profile software with a convenient live dataviz web interface. It also support all scripting languages and binary formats.
This article focuses on localhost profiling but you can use a different network layout. I wrote it because since Pyroscope was merged with the Grafana project, the documentation for the binary profiling was removed and a lot of confusion was added even though it's still possible to perform it.
feel free to share this article or drop a message with your feedback.
Introduction
Pyroscope was designed for developers to efficiently forward profiling data to a web interface and is effectively one of the most exciting solution I came across.
It generally requires to use the SDK matching your language to forward profiling data, but recently started support eBPF with Linux, allowing to also profile binaries. It can even profile your entire system CPUs, or kubernetes cluster.
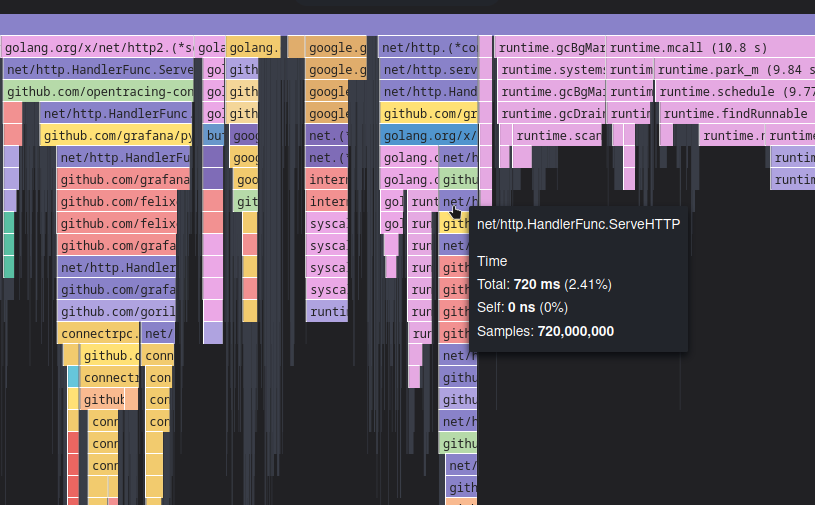
The main utility it provides is the CPU flame graph, which tells you the proportion
of time the CPU is spending in each frame stack call. It is therefore a hierarchical structure,
often looking like the following:

You also have the ability to monitor memory allocation, memory usage, goroutines (for Golang), or even mutex lock times.
A general use case is when you want to troubleshoot performance issues for a piece of software. It is so light it even makes sense to use it in production.
To me, this is an underrated must have, paired with tracing solutions like Uptrace, to design and maintain efficient software.
Deploying pyroscope web interface
We can use the container image to deploy it locally:
podman run -it -p 4040:4040 docker.io/grafana/pyroscope
# or for docker
docker run -it -p 4040:4040 docker.io/grafana/pyroscope
The server is now listening for metrics.
Pyroscope agent or SDK
You can either use the SDK or the eBPF command line binary profiling. If you want to profile a C/C++ binary, you'd have to resort to the cli agent, and it's generally mandatory for stacks that don't produce binaries to use the SDK. If your language has a Pyroscope SDK and produces binaries, I'd advise going for the SDK as it support more features.
SDKs
SDKs are likely available for your language of choice, a list is available here. Follow the instruction from the documentation relative to your sdk.
it is generally about adding a handfull of code lines to automatically get the profiling data forwarded to the pyroscope we just deployed at http://localhost:4040.
Profiling binaries with eBPF
For binaries, you will need the pyroscope binary.
Pyroscope was bought by Grafana and is currently undergoing changes to merge the project into the Grafana stack.
You need a Pyroscope agent version lower or equal to 0.37 (before the merge started) to support binary profiling, which is yet to be implemented in the Grafana Agent.
Please ensure you are not installing the newer versions.
Once you have the pyroscope (<0.37) installed, simply set the PYROSCOPE_SERVER_ADDRESS environment variable to localhost:4040 and run the following on a Binary with debugging symbols:
sudo pyroscope exec -spy-name ebpfspy ./my/Binary
Conclusion
You should now see the frame stack for your running binary or script at http://localhost:4040, and have the ability to filter and compare by time.
Make sure to also check the other profling modes available.
Happy profiling!